Key Statistics
Financial Performance

The Signal Report
PREMIUMBased on our analysis, Vistra Corp. demonstrates strong buy fundamentals. with revenue reaching $19.2B and growing at -5.5% year-over-year. Our fair value estimate of $212.25 suggests +51.6% upside from current levels of $140.02. The company maintains a competitive position in Utilities, supported b...
🔒 Members Only →Wall Street Consensus
Total Returns
Company Profile
Vistra Corp., together with its subsidiaries, operates as an integrated retail electricity and power generation company in the United States. The company operates through five segments: Retail, Texas, East, West, and Asset Closure. The company retails electricity and natural gas to residential, commercial, and industrial customers across states in the United States and the District of Columbia. It is also involved in electricity generation, wholesale energy purchases and sales, commodity risk management, fuel procurement, and fuel logistics management activities. In addition, the company engages in decommissioning and reclamation of retired generation facilities, including mines, and battery
| Period Ending: |
|---|
| Total Revenues |
| Gross Profit |
| Period Ending: |
|---|
| Total Assets |
| Total Liabilities |
Vistra Corp. reported earnings results for the periods shown below. 7 of the last 8 quarters have reported results.
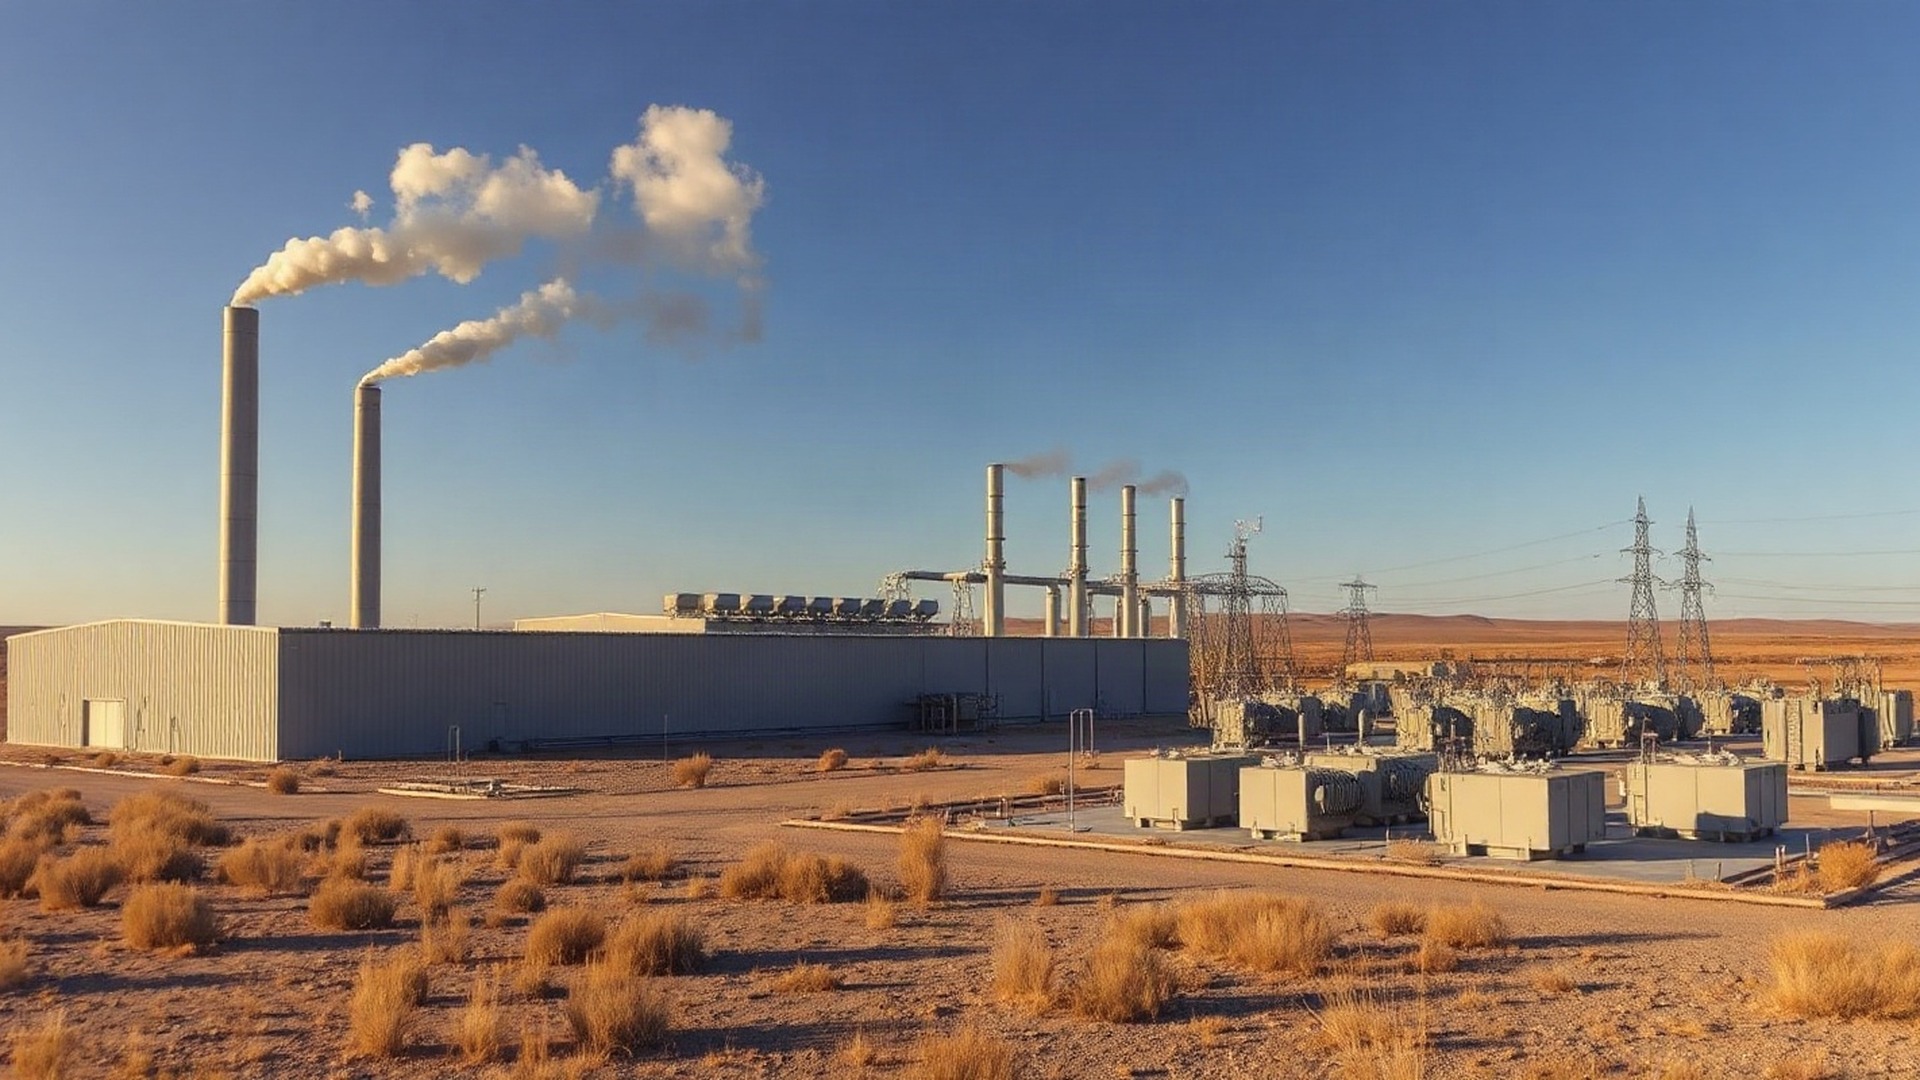
Power Is the AI Bottleneck, and Vistra Keeps Signing the Contracts
Vistra signed a 20-year power purchase agreement with New Era Energy & Digital for up to 207 MW from its Odessa gas plan…
From Retirement Path to AI Backbone
Vistra signed the largest corporate-backed nuclear uprate deal in U.S. history, stacked a pending $4.7B gas acquisition …

When the AI Infrastructure Trade Cracks: 2 Overhyped 'Deals' to Avoid — And 2 Long-Term Growth Steals to Buy on the Dip
Not every AI infrastructure stock on sale is a bargain. Low-margin server assemblers and stretched cooling plays carry h…
Vistra's Nuclear Bet with Meta Looks Like the Trade of the Year at 28% Off the High
Vistra Corp has signed the largest corporate nuclear uprate agreement in U.S. history with Meta — a 20-year, 2,609 MW de…
The AI Power Play Wall Street Is Still Sleeping On
Vistra Corp (VST) is the overlooked middle ground in the AI power race — nuclear baseload from the Energy Harbor acquisi…