Key Statistics
Financial Performance

The Signal Report
PREMIUMRTX Corporation exhibits a Narrow moat driven by strong intangible assets and cost advantages within the Aerospace & Defense sector. While its valuation appears stretched on a P/E basis, robust defense spending and a record backlog suggest continued revenue growth and potential for future upside, pa...
🔒 Members Only →Recent Performance & Catalysts
- Continued increase in global defense spending and NATO targets
- Successful execution of large multi-year defense contracts (e.g., AMRAAM, SM-6, Tomahawk)
- Improved operational margins as fixed-price contracts mature
- Increased production capacity to meet growing demand
Core Strengths & Moat Sources
Main Risks
- Geopolitical shifts leading to reduced defense spending or contract cancellations
- Supply chain constraints hindering the ability to convert backlog into shipped hardware and revenue
- Challenges in ramping up production for large multi-year contracts, leading to execution risks and potential penalties
- Transition to fixed-price contracts shifting more pricing risk onto the company for unproven development hardware
🐂 Bulls Say
- Record defense backlog of $289 billion provides long-term revenue visibility and stability.
- Consistent outperformance on EPS estimates suggests strong operational management and execution.
- RTX is at the center of a defense supercycle, benefiting from increased global security concerns and NATO spending.
- The company's diversified portfolio across Collins Aerospace, Pratt & Whitney, and Raytheon provides resilience across different market cycles.
🐻 Bears Say
- High P/E ratio (34.04) indicates a potentially stretched valuation, despite strong growth prospects.
- Significant debt load of $38.9 billion could be a concern if interest rates rise or cash flow generation falters.
- The transition to fixed-price contracts carries increased risk for development programs, potentially impacting margins if cost overruns occur.
- Capacity constraints, rather than demand, could limit the pace at which the record backlog is converted into revenue.
Financial Health
RTX maintains a solid balance sheet with $8.3 billion in cash, although it carries a substantial debt load of $38.9 billion. Strong free cash flow generation of $9.9 billion provides ample liquidity to service debt and fund operations, mitigating immediate concerns regarding its leverage.
Analyst Note
RTX is well-positioned to capitalize on the ongoing defense supercycle, but execution on its massive backlog and managing the shift to fixed-price contracts will be critical to realizing its full potential.
Business Strategy & Outlook
RTX's strategy focuses on leveraging its comprehensive portfolio to serve global commercial, military, and government customers. The company is actively working to convert its record backlog into delivered systems, expand production capacity, and innovate within its core aerospace and defense segments, aiming for sustained long-term growth and market leadership.
Wall Street Consensus
Total Returns
Company Profile
RTX Corporation, an aerospace and defense company, provides systems and services for commercial, military, and government customers worldwide. It operates through three segments: Collins Aerospace (Collins), Pratt & Whitney, and Raytheon. The Collins segment offers aerospace and defense products, and aftermarket services for civil and military aircraft manufacturers and commercial airlines, as well as regional, business, and general aviation, defense, and commercial space operations. This segment designs, manufactures, and supplies electric power generation and management and distribution, environmental control, flight control, air data and aircraft sensing, engine control, and engine nacell
| Period Ending: |
|---|
| Total Revenues |
| Gross Profit |
| Period Ending: |
|---|
| Total Assets |
| Total Liabilities |
RTX Corporation reported earnings results for the periods shown below. 7 of the last 8 quarters have reported results.
A Decade of Missiles: The Pentagon Just Signed RTX’s Next Ten Years
RTX beat the quarter and raised guidance again, but the real news was the order book: Raytheon converted its February fr…
Defense Contracting Overhaul Shifts Pricing Risk to Wall Street
The Pentagon is moving away from guaranteed cost-plus contracts to favor fixed-price production and commercial off-the-s…
RTX's $20.7 Billion AMRAAM Award Is Provisional and Capacity Is the Constraint
The Pentagon handed Raytheon a five-year AMRAAM contract worth up to $20.7 billion with two option years, then obligated…
RTX Builds the Shields Catching Iranian Missiles Out of the Sky
Projectiles hit two oil tankers in the Strait of Hormuz, and defense stocks popped on renewed U.S.-Iran hostilities. RTX…
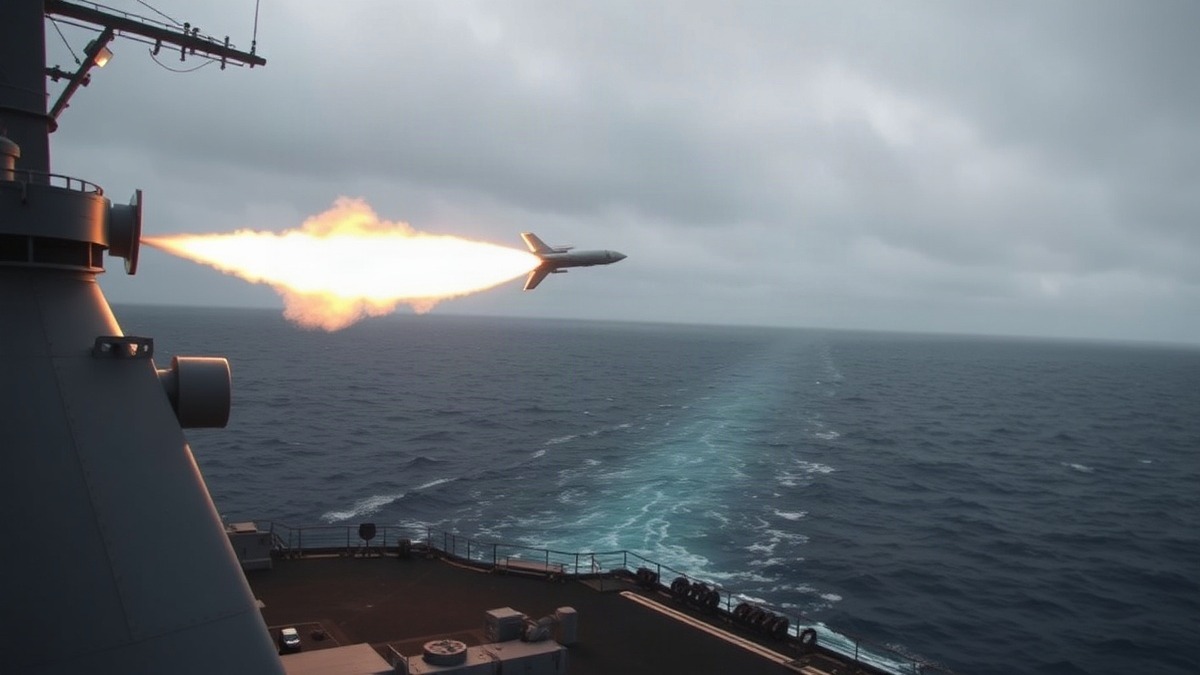
The Navy Just Bet $22.9 Billion That RTX Can Build 17x More Tomahawks
The Navy handed Raytheon a $22.9 billion, seven-year contract to lift Tomahawk production from roughly 60 missiles a yea…
Raytheon's $289 Billion Backlog Proves the Iran War Supercycle Is Real
Raytheon Technologies reported a blockbuster Q2 with a record $289B backlog and raised full-year guidance, validating th…
The Defense Supercycle Is Here. RTX Has $271 Billion Reasons to Care.
RTX (RTX) is sitting on a record $271 billion backlog — that's over three years of locked-in revenue — as NATO defense s…
July's Top 6 — The Six Stocks That Actually Make Sense Right Now
Six stocks, one thesis. AI infrastructure, defense spending, and energy scarcity aren't slowing down. Here's why Broadco…

RTX Just Crossed a Quarter-Trillion Market Cap — And the Defense Backlog Says It's Not Done
Raytheon Technologies hit $251B market cap as its defense backlog swells to a record $271 billion. With NATO spending ta…
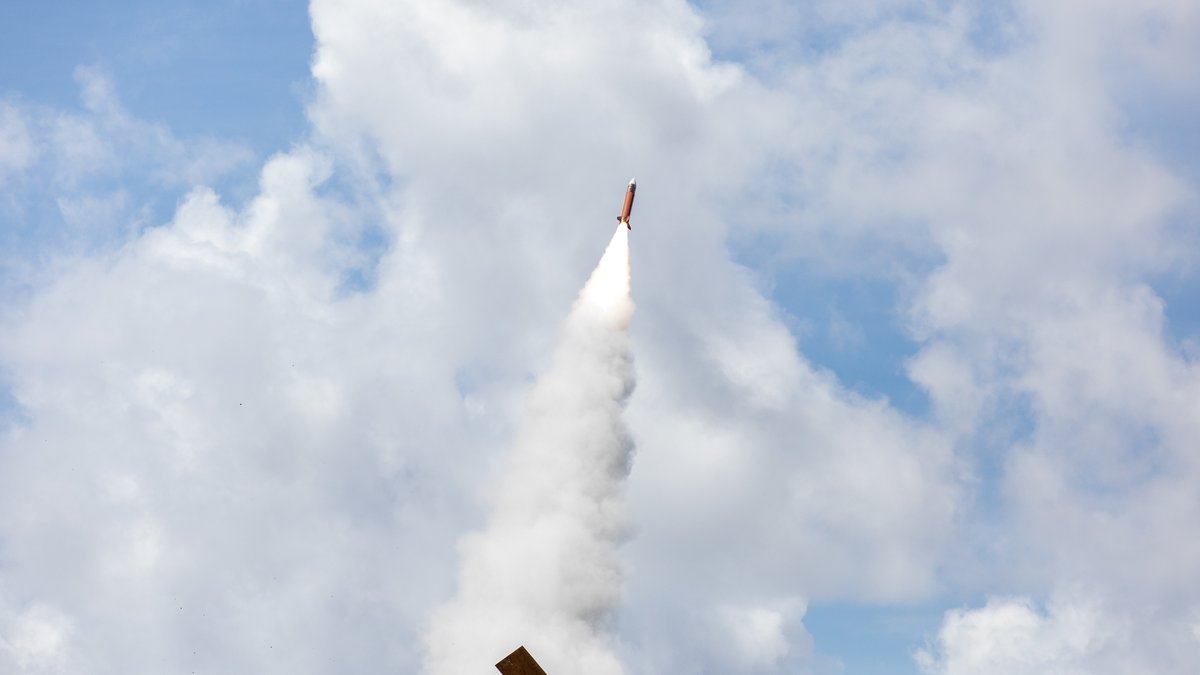
Iran Just Threatened U.S. Tech Giants — Defense Stocks Are the Only Safe Haven
Iran's IRGC issued a formal warning that American tech companies — including Nvidia, Apple, and cloud infrastructure pro…
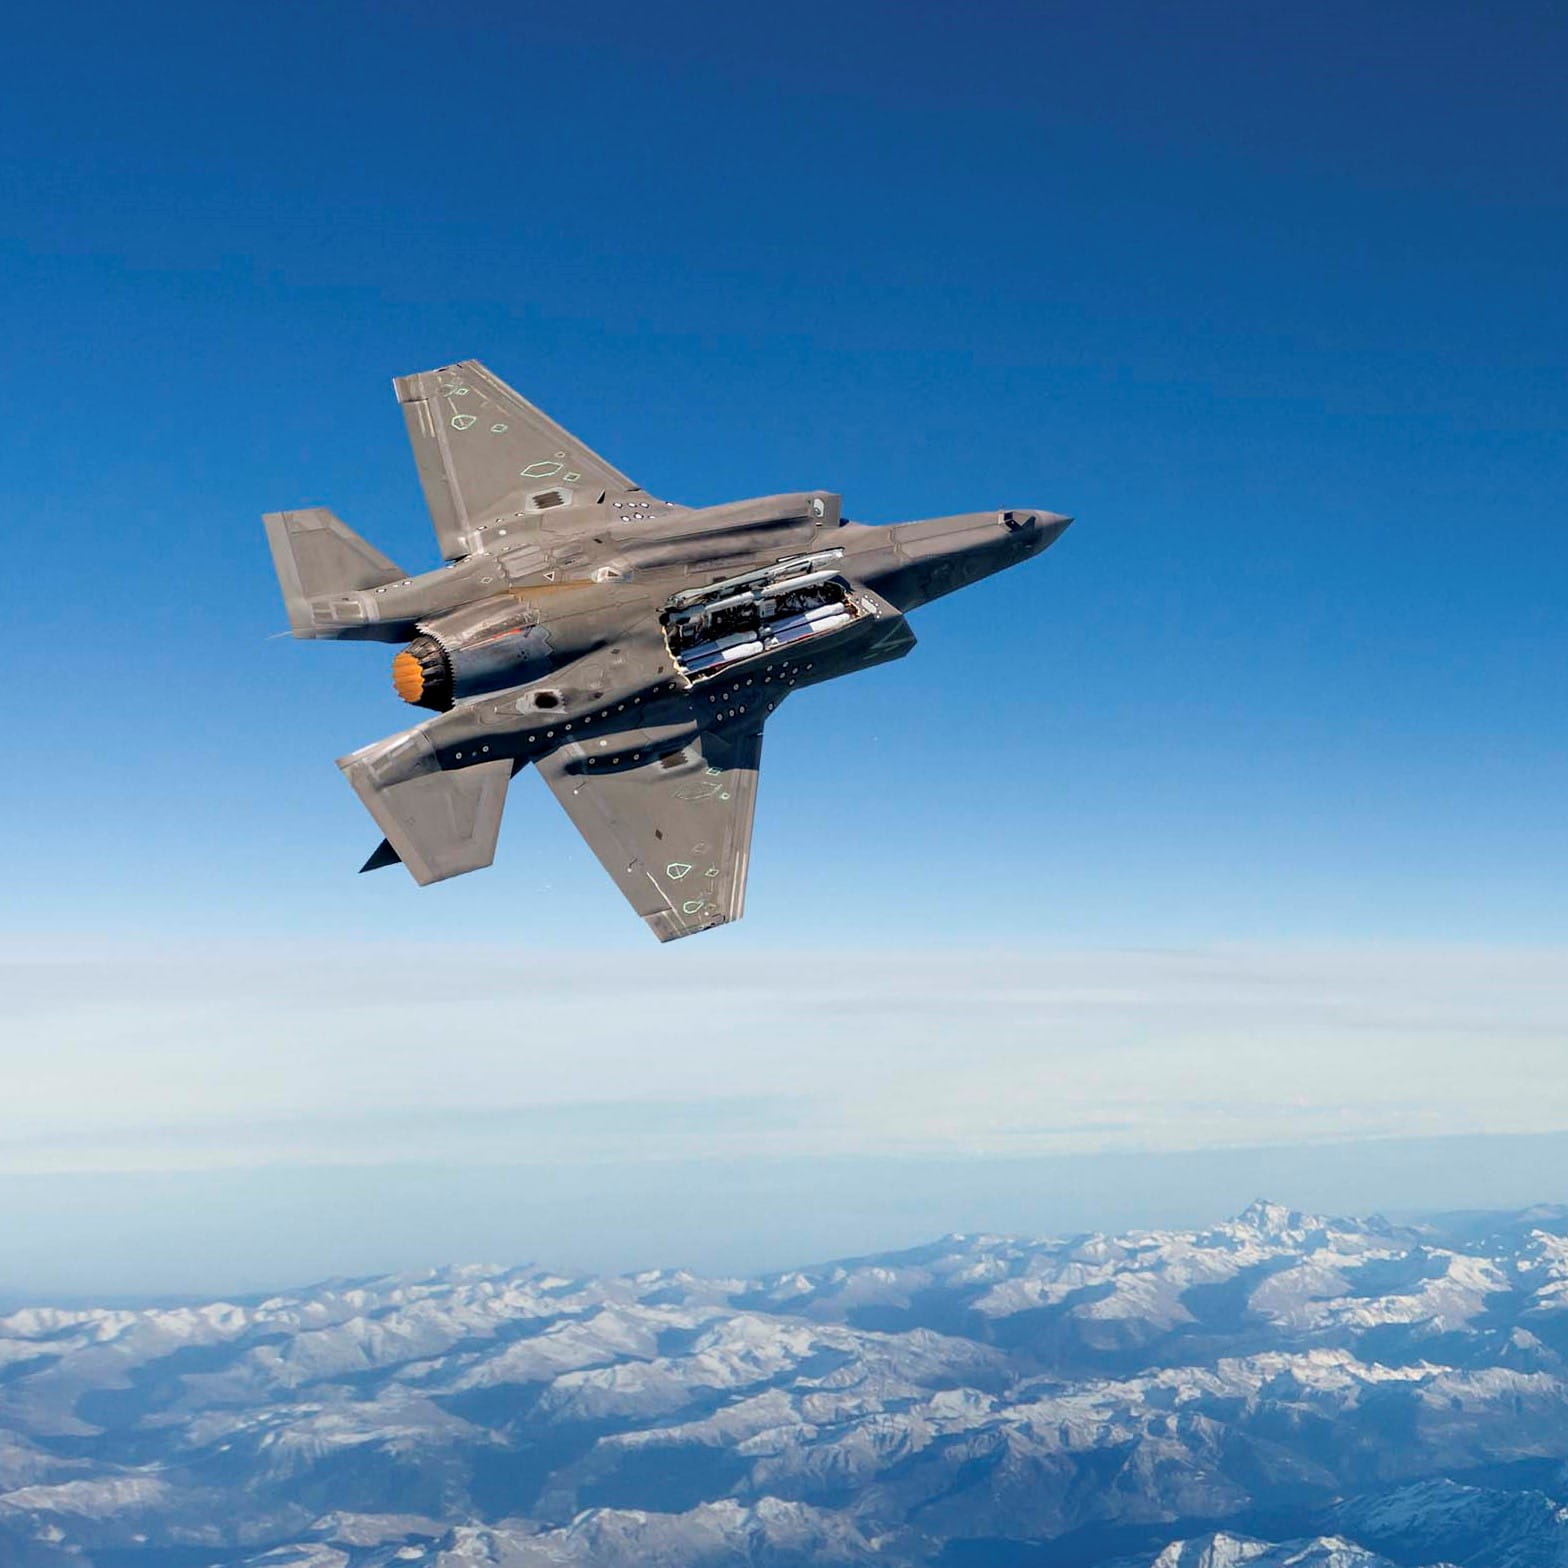
RTX Just Dipped 18% From Its Highs. Here's Why That's Your Entry Point.
RTX dropped 18% from its $214 high despite posting $90B revenue, $7.2B FCF, and a growing dividend. At 25x forward earni…